Why Are UPS & FDX Increasing Fuel Surcharges While Fuel Costs Are Dropping? Have They Crossed a Line, and Does Anybody Care?
At Shipware we regularly post information on the endless carrier pricing changes, formula-rule changes, and carrier reliability data. When we post articles on annual pricing changes, or which carrier is faster, substantial views and impressions are generated. Historically, when we post information on fuel charges, it receives far less interest.
Perhaps this lack of interest is because the carriers have successfully marketed fuel surcharges as being tied to the price of fuel, giving off the illusion these charges are immutable. Or, perhaps because of complexity, most shippers avoid doing the data comparisons needed to unpack the current state of a fuel surcharge basis.
Understanding the Fuel Index
Anyone can proactively go to the UPS Fuel Surcharge or FedEx fuel surcharge page website to see what is going to be charged for fuel in a given week. As of 03/26/25, the UPS fuel index was set to charge an additional 18.25% for a Ground shipment (most charges are subject to fuel) to ostensibly cover the cost of fuel.
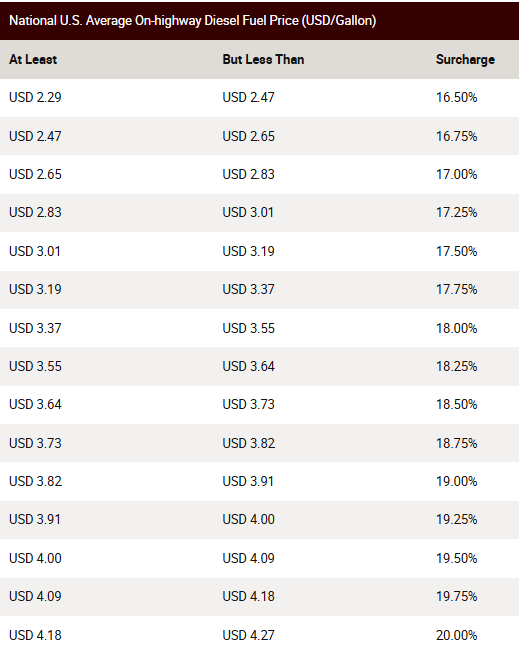
Scrolling down a little further on the UPS website, you see what seems to be a clear logical explanation as to how that 18.25% was derived and “tied” to the price of US On-Highway Diesel Fuel Prices.

Below this, the “Index” lists the fuel ranges based on price per gallon along with the associated surcharge percentage. Generally, this seems straight forward and above board.
Ground Network Fuel Index: (As of 03/26/25):
Historical Correlation Between Fuel and Surcharges
It is important to understand the history of fuel surcharges. Fuel surcharges were originally instituted in the early 2000’s as “temporary” charges. Subsequently, “temporary” became permanent, and shippers have become accustomed to them without much question. Historically, there was a visible tie to the price of fuel. The charts below illustrate from 2012 into the covid era, there is a visual relationship between the price of US On-Highway Diesel Fuel and the percentage being charged for shipments in the Ground network.
Chart(s)1
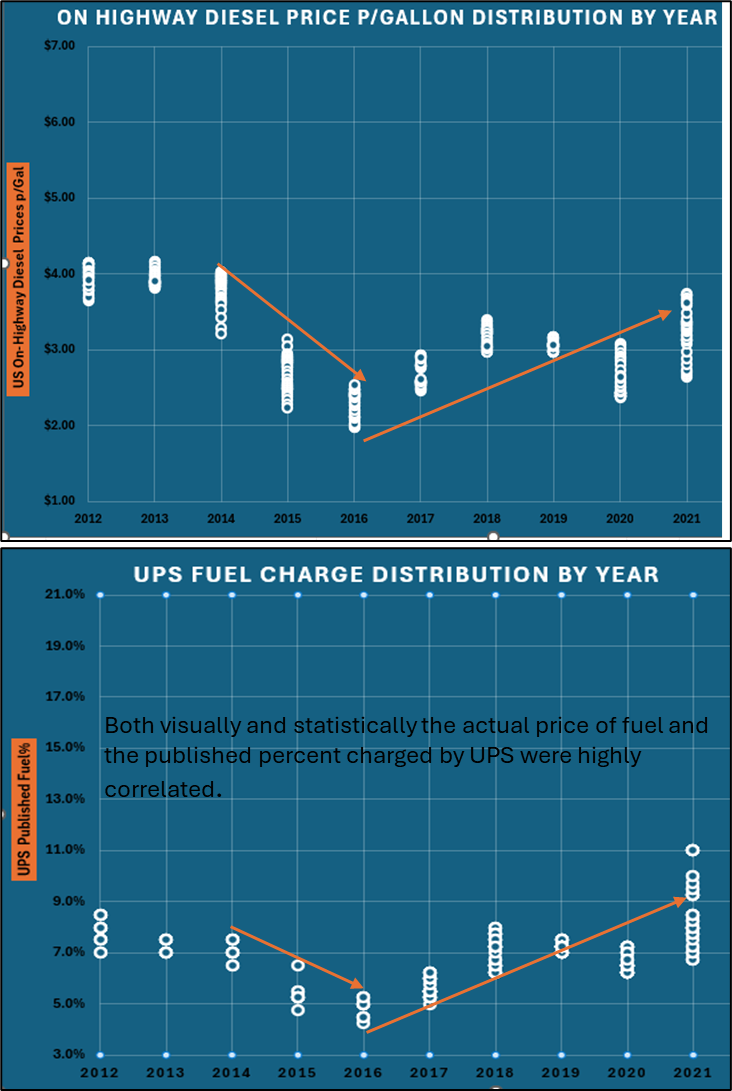
The top chart (above) shows the range of US On-Highway Diesel Fuel price data points by year as published by the EIA, and as quoted by the carriers as the source of the percentage they charge. The lower chart (above) shows the range of the fuel percentage charged by UPS by year for the same period on Ground shipments.
UPS data is being utilized not to single them out, but because their historical data is more extensive in our database. FedEx has a remarkably similar pattern, and both carriers almost always have a very similar fuel charge percentage. Coincidentally, when one of these two independent industry giants makes changes to their complex fuel index, the other typically follows suit soon thereafter.
Notably in this chart, the price of fuel and surcharge percentage have a high correlation. Correlation is a statistical measure that expresses the extent to which two variables are linearly related. The correlation scale ranges from -1 to 1 where measurements above ~.60+ are generally considered correlated.
- From 2012 to 2019 the correlation was .85 (Highly correlated)
- From 2012 to 2020 (on set of covid) the correlation was .79 (Highly correlated)
- From 2012 to 2021 the correlation was .71 (Still highly correlated)
In looking at the gradual downtrend in correlation that began with the onset of covid, it is easy to understand how the changes on something still so highly correlated would be considered “transitory.”
Breaking the Link: Post-COVID Trends
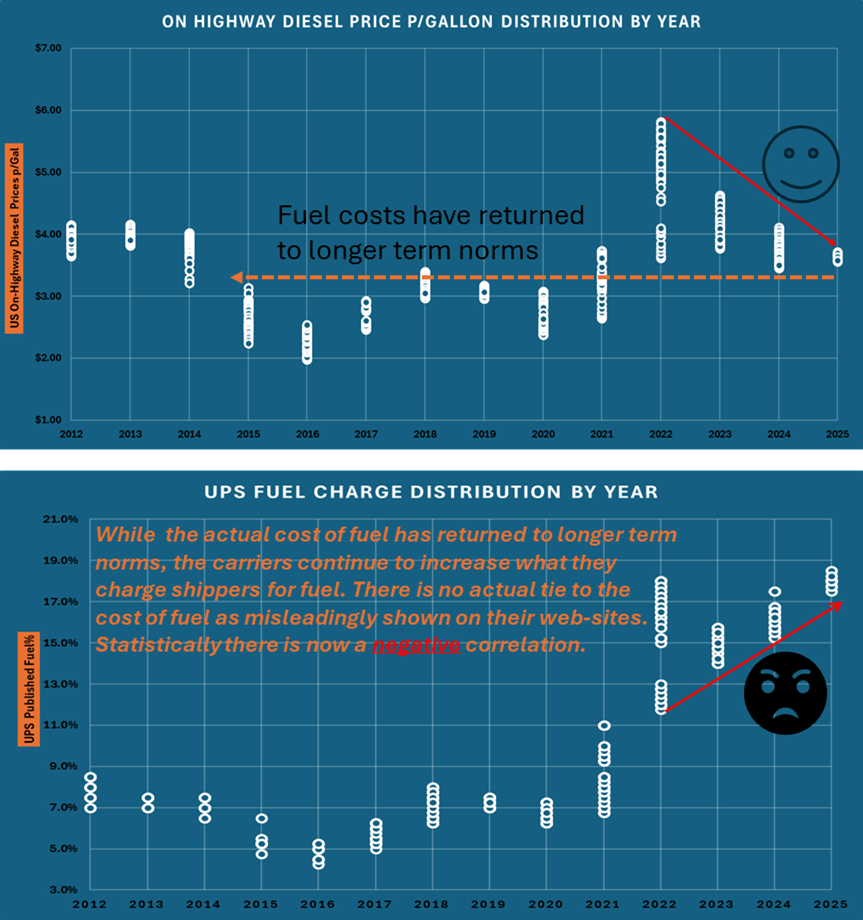
The charts below (Charts 2) show the same data as above extended out to the end of March. (03/26/25) Turns out that although covid diesel fuel costs were “transitory”, the subsequent fuel percentages charged by UPS and FedEx were not and continued to rise. The correlation since 2023 is now -.50. (03/26/25) In other words, both carriers took what was a strong and clear positive correlation existing for years, and turned it into a highly negative correlation.
There is no longer a correlated link between the price of fuel and what they charge as implied so prominently on their website(s). FedEx, the other independent industry giant, also managed an almost identical complete reversal of years-long statistical trends.
Chart(s)2:
How did this happen? The simplest explanation is covid. Both carriers’ volumes exploded, and carrier networks were at capacity. Understandably, both carrier margins expanded significantly by a variety of means. Year round “Peak” surcharges were imposed that have since been rebranded as “demand” surcharges.
Both carriers began making changes to the fuel index in a frequency never seen before. Basically, they would expand the price range of fuel where at each fuel increment, higher percentages were charged. It was easy to do when the media provides constant coverage of inflation at 40 -year highs. In this environment most shippers accepted that the percentage they were paying for fuel was going up.
What most shippers were missing was that the carriers kept re-engineering the index and locking in a higher surcharge so that if diesel prices inevitably came back down, they would still be collecting a substantially higher fuel percentage. In earning calls the carriers would allude to increased margins partly due to fuel revenue. At the same time inflation data experts considered the general inflation we were all seeing as “transitory.”
For the sake of simple math if before covid a shipper was paying $15 pre-fuel for a shipment (Example):
- Then charged 10% for fuel – $15 x 10% fuel = $1.50 in carrier fuel revenue
- Once in covid with rates increases & peak demand charges the same shipper is now paying $18 pre-fuel for the same shipment (20% Increase)
- However, if the carrier is now also charging 15% for fuel – $18 x15% fuel =$2.70 in fuel revenue – An 80% increase in carrier fuel revenue for the same shipment
So, what happened once we were through the crisis? Carrier volumes went down – the volume spikes were indeed “transitory.” Earnings calls alluded to “decreased demand, offset by higher margins.” Despite this lack of demand the carriers clung to continued year-round “demand” charges into 2025. Both carriers also continued to increase the frequency of fuel index modifications, resulting in higher fuel surcharges, while the actual cost of fuel was dropping to its historical norms.
At the end of the day like many other corporations in must have industries, covid created a supply and demand situation where companies could increase margins by a variety of means. Inflation experts expecting high fuel prices to be transitory, did not factor in the greed aspect or how easy and frequent it has become for the carriers to implement under the radar price increases by changing the published fuel index. They are now doing so several times a year regardless of the actual cost of fuel.
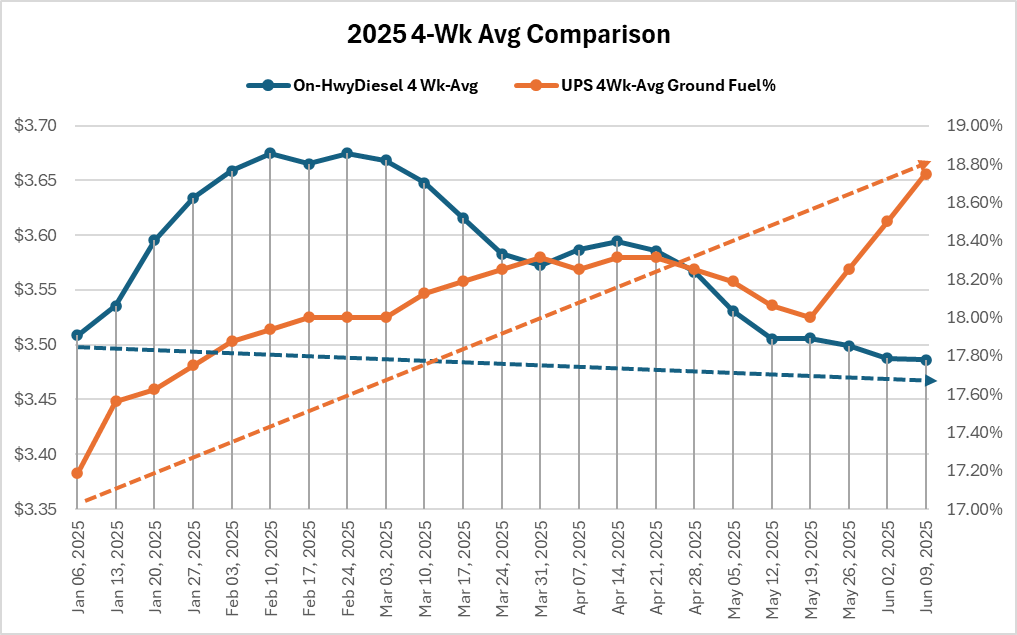
The updated chart below compares the rolling 4-week average of On-Hwy diesel fuel to the rolling 4-week average of what UPS is charging. Clearly the trends continue to move in opposite directions. Notice the spike at the end of May into declining fuel prices after the latest index “maneuvering”.
Chart 3 -Year To Date Rolling 4-Week Averages:
Manipulation or Market Strategy?
The issue here is the disingenuous and misleading way the carriers are foisting these huge under the radar increases on shippers via fuel index engineering. If you publish a charge is tied to the price of fuel, it should be. It should never be negatively correlated. Being mainly a data guy and not a legal expert, and beyond basic right and wrong, have the carriers crossed a legal line? Could a case be made for market manipulation?
Most shippers do not have the time or resources to quantify this data, the pricing power to fight it, or a viable alternative. The carriers know this, and it is now resulting in an absurd frequency of fuel index modifications to the detriment of shippers and consumers receiving shipped goods.
Hopefully, and at a minimum, enough shippers will notice and hold their carrier(s) accountable. There must be mass recognition from shippers of this issue. They need to create a constant flow of loud push-back to end this. Shippers in unison must make it a pain point for the carriers, rather than the current under the radar let’s do it again cash grab fuel charges have become.
Finally, the chart below shows what that carriers have taken years to engineer and have been fine-tuning in an unprecedented manner since covid. It compares what the average price of diesel fuel was in 2012 and 2013 when the carrier fuel index was correlated, to 2025, where it is not. Notice the average price of fuel was higher in that period than it is now.
Chart 4: When Diesel Cost More
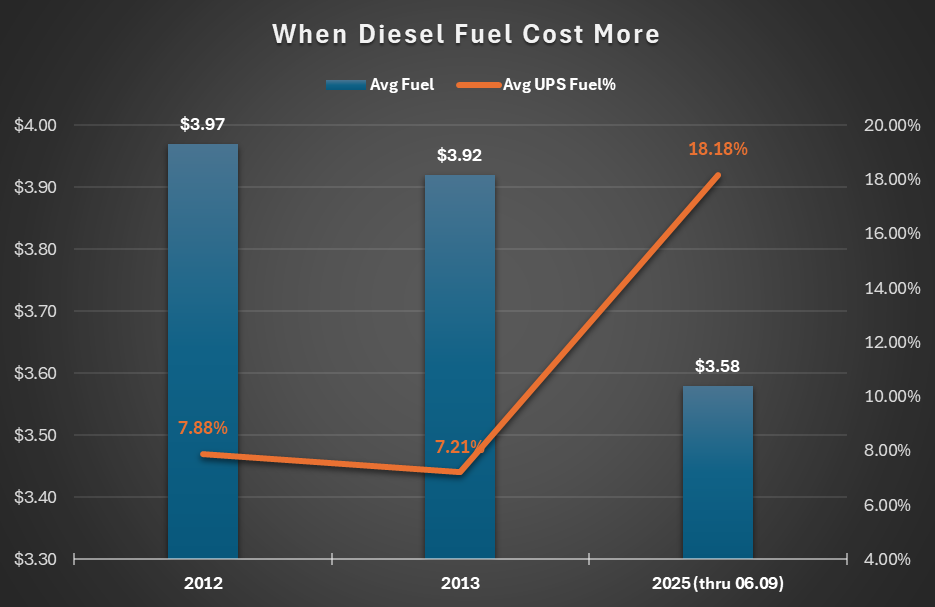
Somehow without uncoupling a clear statistical tie to the price of fuel, the carriers survived in 2012 & 2013 at higher fuel prices. They have been able to get away with astonishing increases since then because of shipper complacency, and a lack of independent oversight.
To the carriers’ credit they are very good at hedging fuel costs via futures contracts. They have also further reduced actual fuel needs by utilizing optimized routes and more fuel-efficient vehicles. This in unison with the exorbitant increases documented above has led to fuel discounts being offered to smaller shippers. However, even if a 30% discount were obtained, it still results in a 100%+ increase over what was charged in 2013 when fuel cost more. What are the odds the carriers would return to the fuel index from that period in exchange for no discounts?
Either way, when you publish that what you charge for fuel is tied to the price of fuel it needs to be. The index should not be a tool to increase margins at will on shippers who have little recourse. Hopefully, by posting this it will generate awareness and shipper actions. Want to see how these changes affect your shipping costs? Book a demo with our experts and get a personalized breakdown for your business.
Sources:
